Visualize Knowledge Graphs using cytoscape.js
What is a Knowledge Graph?
The heart of the knowledge graph is a knowledge model: a collection of interlinked descriptions of concepts, entities, relationships, and events.
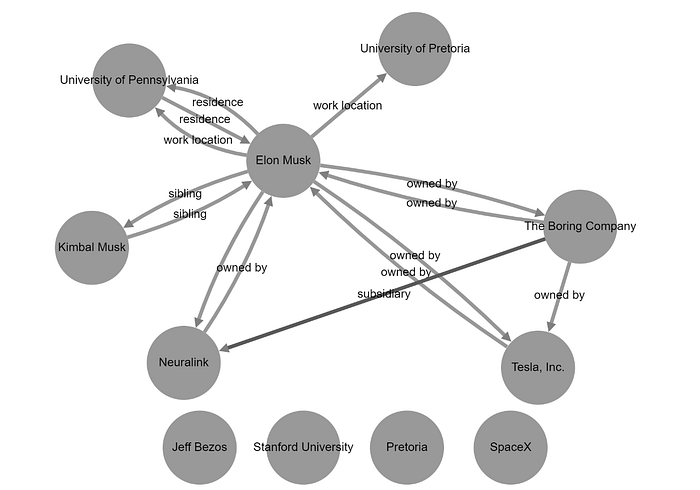
A sample knowledge graph :

In this article, I will share a way to visualize knowledge graph data on the browser using HTML, CSS, and Javascript.
We will be using the https://js.cytoscape.org/ library to create the knowledge graph diagram.
Following is the data.json which we will use which represents the entities and relations in the knowledge graph
{
"entities": [
  {"label": "Organization", "title": "Neuralink"},
  {"label": "Organization", "title": "SpaceX"},
  {"label": "Organization", "title": "Pretoria"},
  {"label": "Organization", "title": "The Boring Company"},
  {"label": "Organization", "title": "University of Pretoria"},
  {"label": "Organization", "title": "Stanford University"},
  {"label": "Person", "title": "Jeff Bezos"},
  {"label": "Organization", "title":"University of Pennsylvania"},
  {"label": "Person", "title": "Kimbal Musk"},
  {"label": "Organization", "title": "Tesla, Inc."},
  {"label": "Person", "title": "Elon Musk"}
],"relations": [
  {"source": "Elon Musk", "target": "Neuralink"},
  {"source": "Tesla, Inc.","target": "Elon Musk","type": "owned by"},
  {"source": "Elon Musk", "target": "University of Pennsylvania", "type": "residence"},
  {"source": "Elon Musk", "target": "Tesla, Inc.","type": "owned by"},
  {"source": "The Boring Company", "target": "Tesla, Inc.", "type": "owned by"},
  {"source": "Elon Musk", "target": "Kimbal Musk", "type": "sibling"},
  {"source": "University of Pennsylvania", "target": "Elon Musk", "type": "residence"},
  {"source": "The Boring Company", "target": "Neuralink", "type": "subsidiary"},
  {"source": "Elon Musk", "target": "University of Pretoria", "type": "work location"},
  {"source": "The Boring Company", "target": "Elon Musk", "type": "owned by"},
  {"source": "Kimbal Musk", "target": "Elon Musk", "type": "sibling"},
  {"source": "Neuralink", "target": "Elon Musk", "type": "owned by"},
  {"source": "Elon Musk", "target": "The Boring Company", "type": "owned by"},
  {"source": "Elon Musk", "target": "University of Pennsylvania", "type": "work location"
}]}
CDN link to get the Cytoscape library
https://cdnjs.cloudflare.com/ajax/libs/cytoscape/3.23.0/cytoscape.min.js
create_knowledge_graph.js
- Read the data.json
import data from './data.json' assert { type: 'json' };
const knowledge_graph_json = JSON.parse(JSON.stringify(data));
2. Create nodes and edges array as per the representation needed by the Cytoscape library
var nodes = []
var edges = []for (const index in knowledge_graph_json['entities']) {
  nodes.push({
    data: {id: knowledge_graph_json['entities'][index]['title']}
  });
}for (const index in knowledge_graph_json['relations']) {
  edges.push({
    data: {
      id: index,
      source: knowledge_graph_json['relations'][index]['source'],
      target: knowledge_graph_json['relations'][index]['target'],
      label: knowledge_graph_json['relations'][index]['type'],
    }
  });
}
3. Create the ‘cytoscape’ object and style the nodes and edges.
var cy = cytoscape({
    container: document.getElementById('cy'),
    elements: {
        nodes: nodes,
        edges: edges
    },
    style: [
        {
            selector: 'node',
            style: {
                "text-valign" : "center",
                "text-halign" : "center",
                "label": 'data(id)',
                "width" : 100,
                "height" : 100
            }
        },
        {
            selector: 'edge',
            style: {
                'width': 5,
                'line-color': 'light grey',
                'target-arrow-color': 'grey',
                'target-arrow-shape': 'triangle',
                'curve-style': 'bezier',
                'label': 'data(label)'
            }
        }
    ]
});
Run the ‘cytoscape’ object giving a layout type. ‘cose’ layout works well with visualizing knowledge graphs.
cy.layout({name: 'cose'}).run();Other layout types
presetrandomgridcircleconcentricbreadthfirstcose
Running the above will create a diagram as follows in the browser
Link to GitHub repository for the source code:
Few handy links to get started with Cytoscape js:
Happy Reading!
Enjoy!
Reference